The Hardware Management Pack discovers and monitors the health of hardware components: processors, memory, network adapters, storage, management controllers, power supplies, fans, temperature sensors, and voltage sensors. The Hardware Management Pack can also discover and monitor the health of system-management software, such as IBM® Director Agent, IPMI driver, IBM IPMI Mapping Layer, and ServeRAID™ Manager Level 1 Agent.
Component discovery and health monitoring depend on firmware support, hardware compatibility, and management-software support. Because of the various factors involved, not all components are always discoverable. If a component is not discovered, it cannot be monitored or managed.
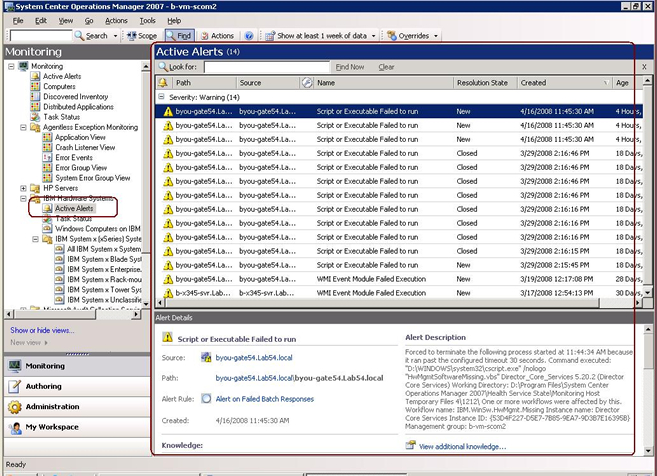
- Click Active Alerts to see if any Critical
or Warning alerts are associated with your IBM Hardware. The following graphic shows an example of how active alerts might be displayed:Figure 1. Example of active alerts in managed systems
Go to Using Health Explorer to identify and resolve problems to learn how to use the Health Explorer to examine a critical problem.