You can use the Health Explorer to identify and resolve error states
that show up when monitoring IBM® systems and hardware components. For a quick check
up, you can take a look at Active Alerts, Windows® Computer on IBM System x™ and BladeCenter® x86
Blade Systems, or All IBM System x and BladeCenter x86 Blade Systems. These
views show any existing Alerts on your IBM hardware.
You can use the Health Explorer to view, learn, and take action
on alerts, state changes, and other issues raised by a monitored object. The
Health Explorer helps troubleshoot your alerts.
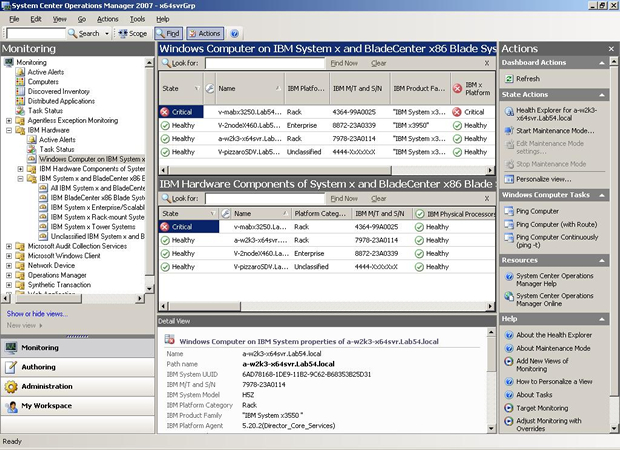
Suppose that you see
a critical error when you are monitoring your systems and hardware components,
such as shown in the following graphic.
Figure 1. An example of a critical
error showing up in a managed system
Use the following procedure to identify and resolve the error.
- To open the Health Explorer when there is a Warning or a Critical
alert, click All IBM System x and BladeCenter x86 Blade Systems;
then double-click on the state. By default, the health Explorer opens with
all failed monitors in expanded view.
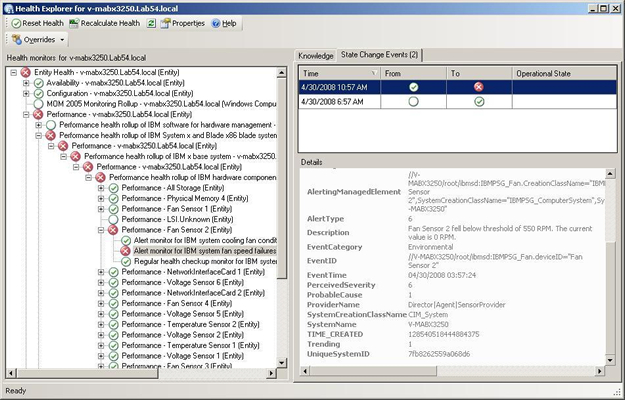
The following graphic
shows how such an error might be displayed in the Heath Explorer:
Figure 2. Example
of hardware components causing a system to be in the error state
If there is no warning or critical alert, highlight an IBM system in
the All IBM System
x and BladeCenter x86
Blade Systems view; then right-click it to show its context menu. Click Open;
then click Health Explorer for system_name.
- Use the Health Explorer to identify the basal level health monitor
that is indicating an error. The indication should refer to a particular component
instance.
In this case, the cause of the error is a faulty fan.
- Click State Change Events in the right-hand
pane for details about the latest state change event.
You can
see the date and the time that the fan went into the error state. You can
also read details about the nature of the error.

