After installing the IBM® Hardware Management Pack, you can use the Monitoring pane of the Operations Manager Console to monitor the system. The IBM Hardware folders and views in the Monitoring pane provide a complete view of the health of your IBM System x™ and BladeCenter® x86 Blade Systems.
- Click the Monitoring tab in the left pane of the Operations
Manager Console to show the systems and hardware components that you can monitor
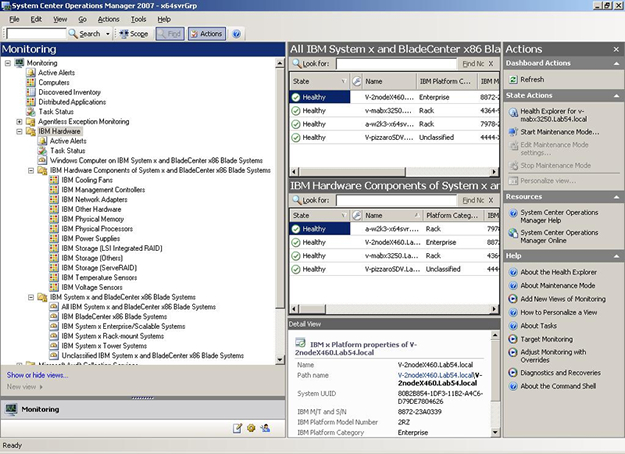
with the Hardware Management Pack. Part of the Monitoring pane of the Operations Manager Console with the Hardware Management Pack installed is shown in the following graphic.Figure 1. Monitoring pane folders and views added by the Hardware Management Pack
Under the IBM Hardware folder are three views that provide a global view that displays aspects of all of your IBM systems: an overall IBM hardware related Active Alerts view, a Task Status view, and a Windows® Computer on IBM System x and BladeCenter x86 Blade Systems view.
There are also two more folders of additional views of different aspects of monitoring data that is collected from IBM systems.
The IBM Hardware Management Pack adds the following folders and views:- IBM Hardware (folder)
- The IBM Hardware
folder includes active alerts, task status, and aggregate targets for all
discovered IBM systems
and hardware components. It also includes systems diagrams.
- Active Alerts (view)
- Active Alerts is a state view of IBM active alerts. Use this view as you would use the view. The difference is that this view contains active alerts for only IBM hardware.
- Task Status (view)
- Task Status is a state view of IBM System x systems. Use this view as you would use the view. The difference is that this view contains the status of each task that was started only on IBM systems.
- Windows Computer on IBM System x and BladeCenter x86 Blade Systems (view)
- Windows Computers on IBM Systems is a state view of IBM System x and BladeCenter x86 Blade Systems. Use this view as you would use the view. The difference is that this view contains computers that are only IBM System x and BladeCenter x86 Blade Systems.
- IBM Hardware Components of System x and BladeCenter x86 Blade Systems (folder)
- This folder contains personalized global IBM hardware views that include hardware
monitors such as network adapters, physical processors, and other hardware
components.
The IBM Hardware Components of System x and BladeCenter x86 Blade Systems state views do not use the dashboard presentation to display state views of specific components. This folder contains state views on a per-hardware-component-class basis. Each component-level state view provides access to more detailed properties of the component instance. Such detail is not possible through a platform-oriented dashboard state view.
- IBM System x and BladeCenter x86 Blade Systems (folder)
- This folder contains a summarized view of all IBM systems in "All IBM System x and BladeCenter x86 Blade Systems" and personalized summary views of specific types of IBM System x and BladeCenter x86 Blade Systems that are grouped by the type of platform, such as Tower, rack, Blade, Enterprise server, and unclassified.
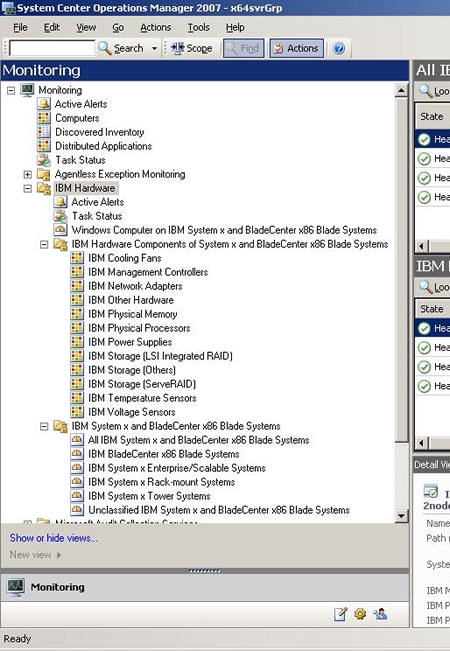
- Click the IBM Hardware Components of System x and BladeCenter x86 Blade Systems view
to find detailed information about hardware components. Only manageable hardware components are discovered and monitored, not all components. For example, a system with one or more non-manageable fans does not have all of its fans discovered or monitored. The following graphic shows the types of manageable components that the Hardware Management Pack can discover and monitor. As shown in the graphic, the view under IBM Hardware labelled IBM Hardware Components of System x and BladeCenter x86 Blade Systems shows various components.Figure 2. The Monitoring pane of the Operations Manager Console, showing the views of manageable components under the IBM Hardware Components of System x and BladeCenter x86 Blade Systems folder
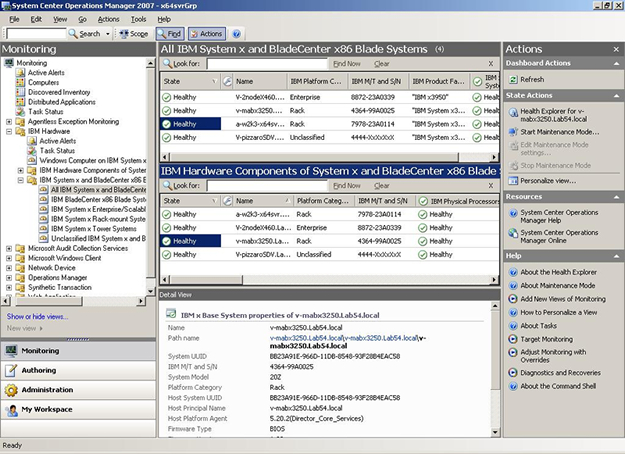
- Click the All IBM System x and BladeCenter x86 Blade Systems view
to show the dashboard views of its systems and hardware components. Each view of systems provides a dashboard view of its systems health states and another dashboard view of its systems manageable hardware components, as shown in the following graphic.Figure 3. Selecting the All IBM System x and BladeCenter x86 Blade Systems view to show both dashboard views